Home > Technology
Technology
- Principle of Whispering Gallery Mode Excitation in Microparticles
- Our Implementation of the Sensing Principle
- System Characteristics & Specifications
- Overview over Competing Technologies
- Application Examples
Principle of Whispering Gallery Mode Excitation in Microparticles
In the following, we want to outline the central aspects of our novel sensing technology based on whispering gallery mode excitations in microparticles.
Whispering gallery mode (WGM): light wave circulating at the equator of a spherical microparticle via total internal reflection. The light wave needs to fulfill the following resonator condition to gain high intensity.
Equation 1 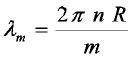 where m = 1, 2, 3, … : is the mode number
λm: is the wavelength of WGM with mode number m,
n is the particle’s refractive index,
and R is the particle radius
Equation 1 links the wavelength of the WGMs with the physical properties of the microparticle, i.e. its refractive index and size. Accordingly, any change in these parameters will cause a change in the wavelength positions and/or width of the WGMs. Figure 1 exemplifies this interrelation for the case of a process of adsorption onto the particle surface.
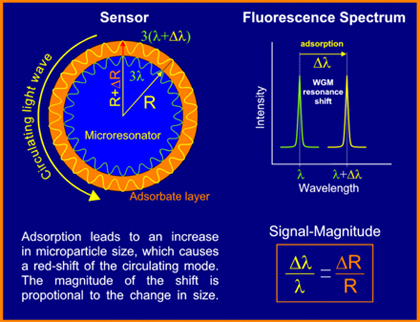 Figure 1
Principle of whispering gallery mode excitation in a spherical microparticle and its use for the quantification of adsorbate levels on the
particle surface.
In fact, equation 1 is only an approximation and a closer treatment within the framework of Mie-Debye theory reveals that the WGMs’ position and width is also influenced by the particle’s environment. In simple terms, this can be motivated by considering the light circulation inside of the particle as caused by repetitive total internal reflections (TIRs) at the particle/ambient interface. TIR, however, depends on the index contrast between particle and ambient.
Therefore, the micro sensors may also be used to measure local refractive indices and chemical concentrations in microvolumina, e.g., in microfluidic systems. For details, we refer to A. Francois und M. Himmelhaus, Sensors 9 (9), 6836 – 6852 (2009) and references therein.
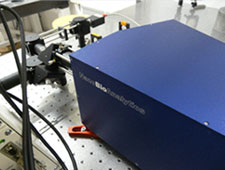
Our Implementation of the Sensing Principle
In practice, operation of the sensors in a complex microfluidic environment demands for a simple and smart way of WGM excitation and detection. For this reason, we apply the simplest conceivable scheme: fluorescent microparticles are optically excited via a focused light beam, e.g. from a laser or LED source. While most of the fluorescence emission will be scattered from the particle, a small portion is trapped inside of the particle via TIR and populates the particle’s WGMs. The latter become visible in the fluorescence spectrum of the particle as narrow peaks, as shown in Figure 2.
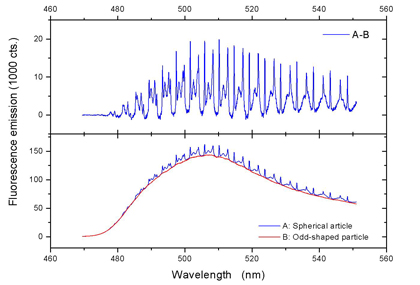 Figure 2
Fluorescence excitation of a polystyrene microparticle with a nominal size of 10 µm:
LOWER IMAGE: Emission of a spherical and of an odd-shaped particle; the latter one resembles the spectral characteristics of the
emission of the dye molecules in absence of the particle. For the measurement, a droplet of the aqueous particle suspension was placed onto a
microscopy cover slip located on an inverse microscope;
UPPER IMAGE: Difference spectrum of the spectra shown in the lower image; WGMs are now clearly discernible; peaks of different
linewidth originate from WGMs of different order.
With this excitation scheme, the micro sensor is optically excited and detected, which means it is basically remote-controlled and may
wonder about in a liquid of basically any kind (as long the latter is transparent in the spectral range of particle operation, which however can be
tuned to match the needs of the respective application). In addition, the absence of any need to mechanically control the particle allows the reduction
of particle size to the smallest possible under the respective conditions. For example, for application in an aqueous environment, we apply routinely
particles with diameters of 5-15 µm. This small size facilitates application of the sensor particles inside of microfluidic systems and – as shown
below – even inside of live cells.
Another advantage of fluorescence excitation of WGMs is the high signal strength that can be achieved, which further simplifies the instrumentation required for operation of the micro sensors.
System Characteristics & Specifications
| Sensor particle: | Size (depending on ambient): 3 – 15 µm Exication range: 450 – 550 nm Emission range: 490 – 650 nm Core material: polystyrene (standard) Surface: routinely coated with layers of polyelectrolytes other coatings as well as surface functionalization (proteins, DNA) on request |
| Excitation: | Via laser or more cost-effectively via LEDs |
| Detection: | Via highly resolving spectrographs with an optical resolution of about 1.5 cm-1 (corresponding to λopt = 0.036 nm, i.e., 0.012 nm/px.) |
Comparison with Competing Technologies
Competing Technologies 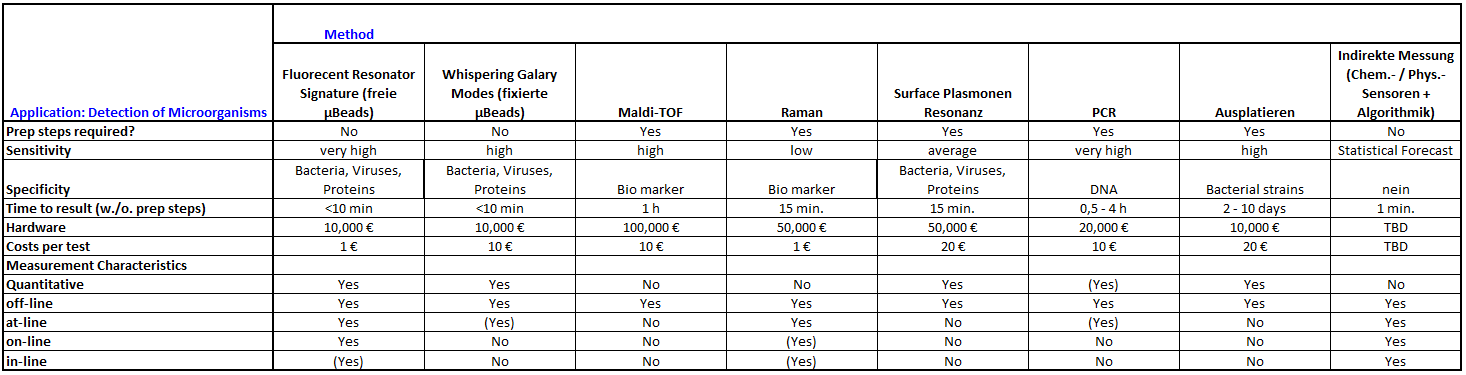
Specifications:
Performance of 10 µm polystyrene sensor particles (excitation around 450 nm, detection in the range 490 – 510 nm) has been validated as follows:
Mass detection limit for adsorbates:a 50 fg
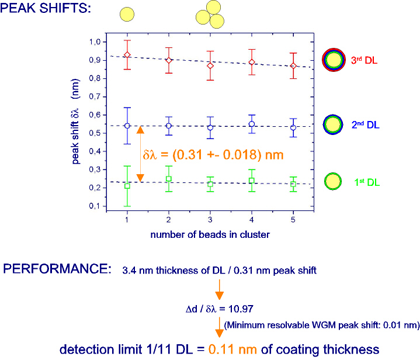
Minimum detectable coating thickness:b 0.11 nm
Minimum detectable refractive index change of the ambient:c 2 x 10⁻⁴
Minimum detectable particle deformation:d 1 nm
Minimum detectable WGM peak shift:e 0.01 nm
References:
a A. Francois, S. Krishnamoorthy, M. Himmelhaus, Proc. SPIE 6862, 68620Q/1-8 (2008)
b A. Francois, M. Himmelhaus, Appl. Phys. Lett. 92, 141107/1-3 (2008)
c A. Francois, M. Himmelhaus, Sensors 9, 6836-6852 (2009)
d A. Francois and M. Himmelhaus, Biosens. Bioelectron. 25 (2), 418-427 (2009)
e applying our spectrograph model WGM01-2010
Application Examples
Application Example 1:
Quantification of Adsorption Layers on the Particle Surface
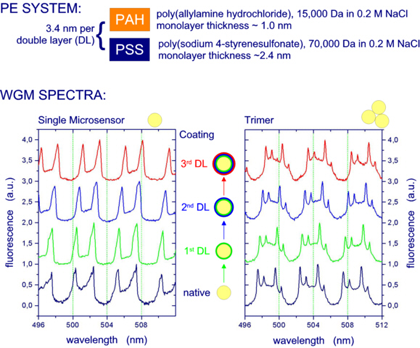
Target: Coating of 10 µm fluorescent polystyrene microparticles with alternating layers of differently charged polyelectrolytes (PEs). WGM spectra of single beads and clusters were acquired in situ in a microfluidic flow cell before and after each coating step. For details, we refer to A. Francois & M. Himmelhaus, Appl. Phys. Lett. 92, 141107/1-3 (2008).
Application Example 2:
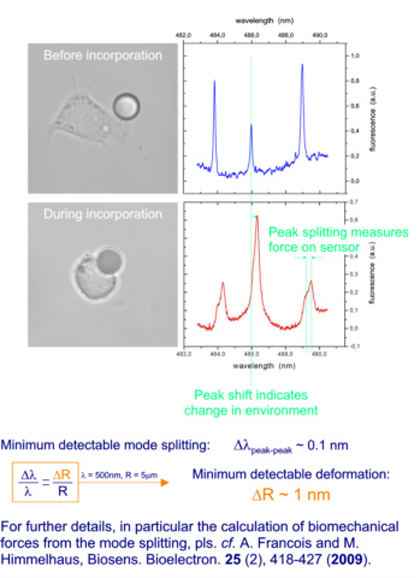
Sensing of Biomechanical Forces
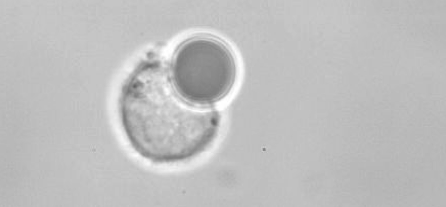
Our sensor particles are sufficiently small for phagocytosis when exposed to live cells, such as macrophages. During this entire process of engulfment by the cell, our sensors can be operated, thereby yielding unrivaled insight into the biomechanics of the process of endocytosis. The data given below gives a brief overview over the key points of this novel approach. For details, we refer to A. Francois and M. Himmelhaus, Biosens. Bioelectron. 25 (2), 418-427 (2009).
Macrophage during endocytosis (incorporation) of a 10 µm WGM Sensor (Courtesy of Dr. Heike Böhm, Max-Planck-Institut Stuttgart)
Changes in the whispering gallery modes during the process of endocytosis: